Italy is approaching the vote: one of the top ten economies in the world finds itself in a serious crisis of credibility of its political class and, consequently, of democracy. A situation that is the same as in all other western countries, bar none. And yet, even in the United States, which is the country suffering the most from the current economic situation, with an enormous increase in poverty, violence and extreme right-wing movements, the data from the statistical agencies all point to radiant times.
This is no surprise. My grandfather, a wise man who only finished primary school, used to admonish me: puppy, economics masquerades as an exact science, because it uses numbers. But there is nothing scientific about it: it is just the extreme expression of humanity’s sick psychology. It doesn’t exist in nature, we generated it, like religion, to believe that, in the end, everything will be fine. And when it does not go well, then panic breaks out, and panic breeds violence and dictatorships.
The holders of the statistical doctrine know this well, and they behave like Celtic druids, encrypting in magic formulas the fact that they are trying, instead of describing reality, to manipulate it, in order to convince the citizens not to lose their composure and faith in the future. Only this time there is the risk that very few people will actually believe them, because the criticism of statistical agencies around the world is growing and people now think like Winston Churchill, who said he only believed in statistics that he himself had falsified[1].
Criticism from Confindustria

25 June 2022: Carlo Bonomi accuses ISTAT of falsifying Italian GDP figures[2]
The bomb exploded when the President of Confindustria, Carlo Bonomi, launched a harsh attack on ISTAT[3], guilty (in his opinion) of having ’embellished’ the statistics on economic trends to please the government: ‘The thing that is beginning to amaze me is the revision of the numbers, because I wouldn’t want anyone to start telling us that everything is going well’ – a sibylline phrase that forced the Institute, on 25 June, to reply without ever naming Bonomi[4]. ISTAT specifies that the revision of the Gross Domestic Product figure for the first quarter, communicated on 31 May, is ‘part of the estimation practice of the national accounts published regularly by the Institute’ and recalls that the complete estimate of the quarterly economic accounts recorded GDP growth of 0.1% in cyclical terms, and 6.2% in tendential terms – an increase compared to the preliminary estimate of 29 April, which showed a cyclical decrease of 0.2% and a tendential increase of 5.8%[5].
Economic analyst Luca Paolazzi[6] intervenes on the issue: ‘Surely President Bonomi is speaking in good faith because he is not familiar with statistical production – in which revision is the norm. In fact, yesterday Istat responded by saying that revisions are practice and a guarantee of quality (…). Not because those who do not do it do not fail, but for the simple reason that statistics is not an exact science, but an approximate knowledge of reality. And it produces estimates with a confidence interval[7]. In the case of GDP, the confidence interval is not there simply because it is not a sample survey; but it is still an approximation. And when there is new and better information, you improve the approximation’ and so far there is no objection[8]: statistics is that discipline that says that if one man ate two hamburgers and the other ate none, they ate an average of one each: in short, it uses the available data to guess.
Paolazzi compares the Italian situation with the American one, where the Bureau of Economic Analysis comes out publicly ‘with three successive GDP estimates for the same quarter: advanced, preliminary and revision. And each year it recalculates the estimates of the previous three. Often the corrections are not small. While Istat’s are historically small. Except in 1986, when the censuses revealed construction activity that had escaped any observation in the 1970s, especially that of local and fiscal authorities’. Paolazzi scoffs at Bonomi: ‘the president of Confindustria doesn’t have to know. Perhaps his Centro Studi does (…). What Bonomi is required to observe instead is respect for the institutions. Attacking the work of the Magistrates’ Court of Statistical Information is tantamount to accusing the President of the Republic’ of fraud: a broadside that has gone down well: Bonomi has been reduced to silence[9].
The issue is central, right now, even if this does not emerge from the flirtatious and inconsistent debate between the parties: if Istat rigged the data to improve the Draghi government’s public image, now that those forecasts clash with reality, any government that comes into office in the autumn of 2022 will be faced with a disgrace for which it is only co-responsible for having previously kept silent, probably out of ignorance and chronic unpreparedness, about the creation of this problem. They should have realised: the trick is there, but it cannot be seen – for it is not the numbers that are rigged, but the method by which they are calculated. This changes nothing to the untouchability of ISTAT, which is parallel to the untouchability of the German BDI or the French MEDEF.
Paolazzi explains: ‘There is a code of behaviour that requires the representatives of the abused institution to return the mud to sender[10]. This accounting criterion legalises certain accounting ‘tricks’, as explained by the European System of National Accounts[11] and the OECD’s Handbook for measurement of the non-observed economy[12]: the figures published by the statistical institutes are not a drawing of reality, but a probability calculation so exact that if you used it to fly between London and Berlin, you would land in Lisbon: official data are estimates, and the data of estimates are practically arbitrary, and can be changed depending on the purpose one wants to achieve – because human beings love simplification, and if there is an official source that certifies that one plus one makes three, as in George Orwell’s Animal Farm, so be it.
How data are created
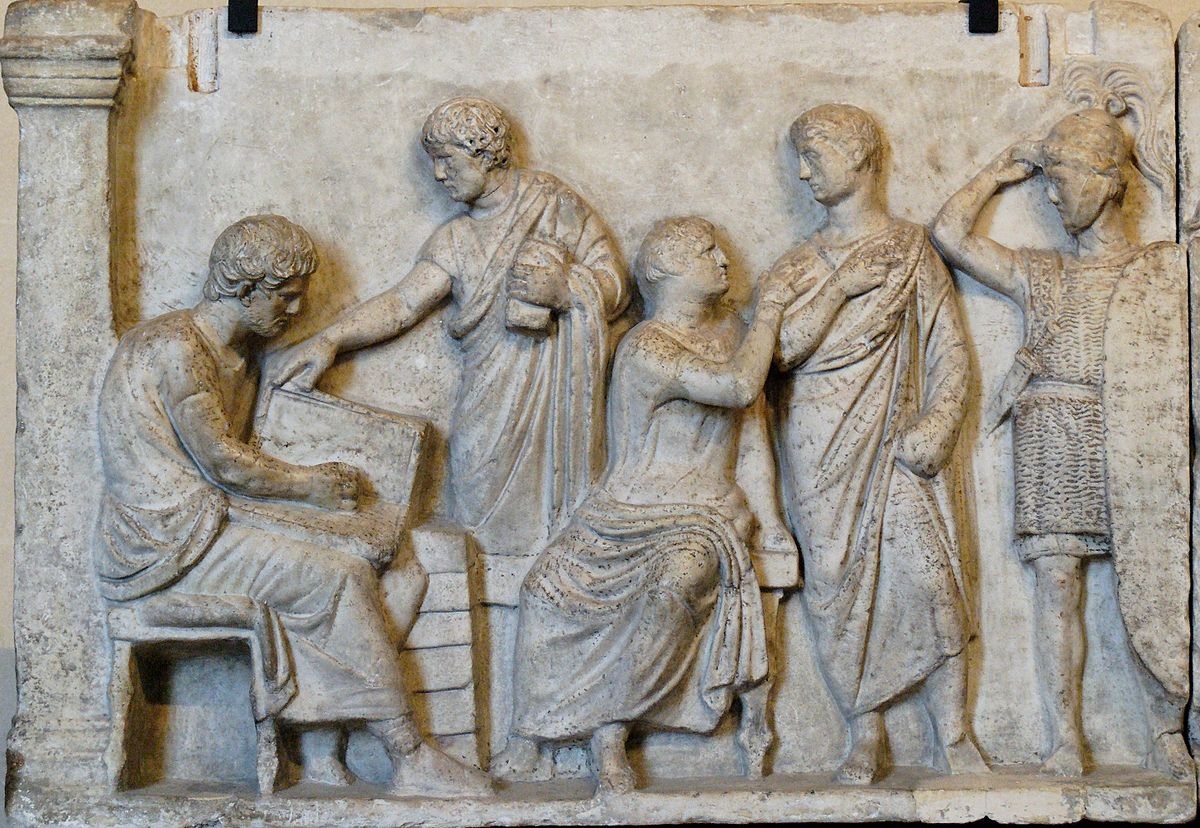
550 B.C.: King Servius Tullius introduces the census law, copied from the examples of the Egyptians and Hebrews, which serves to calculate economic trends and predict possible state expenditure[13]
The figures are basically calculated by taking the exact VAT revenue figures and multiplying them by an arbitrary number that assumes a certain percentage of tax evasion. This is because the VAT figures, for example, do not take into account the black economy, which is not empirically quantifiable, yet exists and has effects on the national and global economic system[14]. We are not talking about the criminal economy, but about absolutely legal activities that escape the counting capabilities of national statistical offices[15]. In addition to these, there is also the criminal economy, which has probably been growing steadily for more than a century[16], and which is included in statistical calculations according to criteria of absolute fantasy, by multiplying the amount of money seized from criminal organisations by a different figure every year and believing that they can thus estimate the influence of this sectoral market within the global one.
In the face of statistics, all types of production are economic activities, if only they respond to a market demand and are sold by consensus between the parties. What does this mean? That blackmail and extortion are excluded from the calculations, and prostitution and the smuggling of drugs, weapons and slaves are included. This is a contradictory dividing line, since in cases of prostitution, what is the percentage of voluntary workers, and what is the percentage of enslaved persons? The calculation is entirely pragmatic, because if the criminal economy has an important weight and displaces the purchasing power and employment levels of a geographical area, then it must still become part of the GDP, and if the police hit the gangs too hard, then the GDP suffers – as demonstrated by the success of the smugglers’ strikes at the port of Naples in the 1990s[17].
In this unscrupulous GDP calculation, the economic damage from corruption and lace (and other types of extortion) is not evaluated. Since these cause worse results when the true figures are checked at the end of the year, the holes are filled by increasing the tax burden: “In countries where the output and added value of illegal production activities are quantitatively insignificant, it is almost certainly a misuse of resources to try to cover them up in the national accounts. Efforts are better directed at reducing the amount of underground domestic production, from the informal sector or for own final use, that is omitted from GDP. The methods available to measure illegal activities are still experimental. In fact, although there seems to be more or less broad agreement on the correctness, in principle, of including illegal activities, there are currently very few countries that explicitly include estimates of illegal production in their national accounts data”[18].
In countries where, like Italy, the informal and criminal economy have a massive weight and thus contribute positively to GDP, keep unemployment low and redistribute wealth in a dishonest and violent, but apparently functional way[19], this not only sustains the state budget (both in an active and passive sense), but also leads to total confusion between the official ISTAT data and the individual’s perception of the real situation (the data say things are going well but there is a lack of money at home to pay the bills) – a fact that obviously shifts the voters’ voting intentions. That said, the way is now open for any manipulation of data that reassures the population instead of helping to frighten them – a fact common to all western democracies[20].
The adventurous GDP calculation
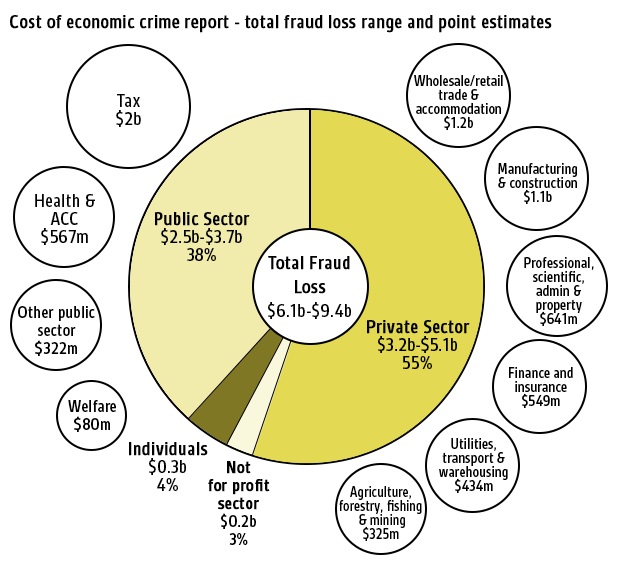
The damage caused by the criminal economy to the national economy according to a New Zealand university study[21]
What are we talking about? In Italy, it is estimated that between 11% and 16% of GDP (between 190 and 250 billion Euro[22]) is linked to the criminal sector (2014)[23]. Narcotics trafficking is estimated to yield around 60 billion Euro per year, of which 24 billion is net profit: frightening figures, if one compares them with the figures for the previous five years[24]. And yet, in some way, these impressive figures must be calculated and included in the general assessment of the economic situation of a national economy: “While we wait to see how we can succeed in constructing and applying homogeneous and credible methods of detection and calculation – with respect to a subject which until now, for reasons of media visibility, has often been characterised by improvisation, automatic repetition of estimates that have never been methodologically controlled – a simple and immediate road that the new methodology gives us to make the GDP increase in accounting terms is there: invest in research and development”[25].
It would certainly be worth doing so, because it is the stability of our parliamentary democracies that is at stake: “One of the most important drivers of innovation is the growing need for information on the part of political decision-makers, both at national and European level, and therefore the need to improve the statistical system’s ability to react and adapt in order to meet new demands in a flexible and harmonised manner, while maintaining high quality standards. In a situation with severe budgetary constraints, such as the current one, pursuing efficiency gains and setting priorities are the most effective ways of working. In the field of statistical production, innovation is the backbone of the Stat2015 multi-year programme which – designed by Istat in line with European recommendations and the Wiesbaden Memorandum on the new design of social statistics – aims at increasing the efficiency of the statistical system and its ability to respond to users’ needs (…). The innovation process triggered has a systemic nature, and is constantly seeking technological and methodological solutions aimed at consolidating and further innovating the results achieved, by implementing and sharing generalised tools and methods, concepts, definitions and classifications, and by developing common technological infrastructures for the various production processes’[26]. An issue that has been in the debate among experts since 2005, because democracy and transparency are at stake[27].
The ISTAT, as it is today, is inadequate to support the confrontation between the social partners and the political debate on fundamental issues such as the loss of purchasing power of wages, the cost of labour, wage inequality and the unsustainable economic conditions of precarious workers: all topics that, in the debates, turn into rants based on ideological prejudices devoid of any representativeness – it is impossible to obtain from ISTAT the information necessary to objectively discuss all these issues[28]. This is not just an Italian problem, the problem is even worse at a European level, since the European Union and Eurostat ‘are not exempt from serious faults when it comes to data for research, both with regard to privacy directives and the provision of data for research’[29]. An intended result: “Eurostat’s decision to discontinue the collection of the European Community Household Panel, which, from 1994 to 2001, provided European researchers with an invaluable source of micro-data on the demographic, economic, and employment status of individuals representative of their populations, is inexplicable”[30].
In its place is EU-SILC (European Survey of Household Incomes and Living Conditions): “this project replaced the European Household Panel Survey (ECHP), conducted between 1994 and 2001, and differs from the latter, firstly, in its legal basis (…). In contrast to ECHP, which was a rigid instrument and whose articulations were established at European level, the EU-SILC regulation leaves the individual countries some margins of flexibility with respect to the use of different data sources (sample survey/archives), the income reference period (fixed/mobile), the mode of collecting information on gross incomes (survey/archives/micro-simulation) and the structure of the national questionnaires”[31]. In short: each country falsifies its own data according to the convenience dictated by its government, which creates a distorted image of objective reality that, in turn, creates social injustice, undermines freedom of choice and even human dignity[32].
A non-random manipulation
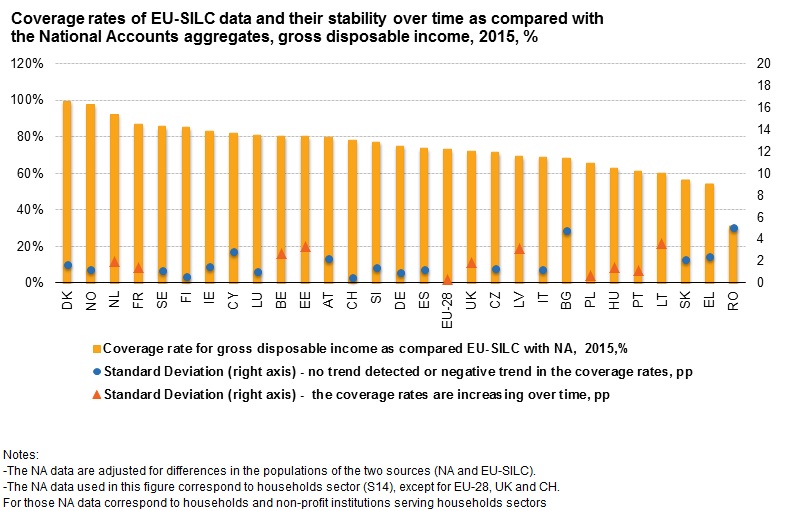
Percentage of correspondence between reality and statistics according to EU rough estimates[33]
This new index was developed from a political consensus rather than a methodological basis, based on the ideological assumption that promoting economic growth and increasing labour market participation are sufficient to reduce material deprivation or the number of jobless households[34]. This contributes not to disambiguating but to masking the causes of growing deprivation and prevents the development of useful policies to solve the problems that we perceive at an intellectual level, but for which we have no useful data and – therefore – no leadership to address anything. The EU-SILC data, while presenting data following a standard template and standard results, fails in its objective of drawing an accurate picture of the homeless, of refugees, of the exploited[35]. There is a suspicion that this is no accident[36]. Even if the method was slightly modified in 2021, it is still incapable of recording definite data on social exclusion, on services, on the situation of disadvantaged groups[37]: everything seems to have been developed out of the need for political consensus and not from a real and genuine methodological basis[38].
This brings us back to Bonomi’s criticism of ISTAT: the exciting results of the Draghi government are not even reflected in the Bank of Italy’s assessments. The current method examines a country’s consumption, investment, public spending and trade balance – all items that translate into a formula Y(GDP)=C+I+G+(X-M)[39]. ‘C’ is the sum of consumption; ‘I’ is the sum of private investment; ‘G’ is government spending; ‘X’ is total exports; ‘M’ is the sum of imports. As the current serious problems of the Chinese economy show, ‘C’ is the key parameter because, no matter how successful the manufacturing industry is and how positive the trade balance is, if people’s consumption is lacking, the economy collapses[40]. In 2021, 57.3 per cent of Italy’s GDP is generated by the consumption of private citizens (EUR 1017 billion), while investment and public spending do not exceed EUR 351 billion[41].
Well. Up to this point ISTAT claims that in 2021, after a really tough year due to the Covid-19 lockdown, household consumption would have reached the remarkable monthly average of 2437 Euro (+4.7% compared to the previous year)[42]. According to current assessments, the growth of the ‘C’ value will be even more impressive (over 9%[43]) in the course of 2022, and the reason is obvious: the explosion of inflation due to soaring energy bills and food costs, due to the war in Ukraine and worsening climate change[44]. This sounds like a positive figure, but it is not, because it corresponds to a decrease in welfare and an increase in citizens’ indebtedness – two parameters that do not appear in the ISTAT data.
Confcommercio comments on the data not with enthusiasm, but with concern[45]. In one of its documents, this organisation emphasises the exceptional character assumed by compulsory consumption as opposed to so-called marketable consumption: people do not spend more because they want to, but because they are obliged to, regardless of the amount of wages available, and 43% of Italian households find themselves on the brink of bankruptcy as a result of this development[46]. A preponderant role is played by expenditure on housing (rent, maintenance, energy, water, waste disposal), which has exceeded 25% of consumption: in 1995 this percentage was less than 18%[47]. Suffering from this inequality is spending on transport and mobility, which is declining in percentage terms: leaving home has become a luxury, using a car a real problem – all things that, looking at the ISTAT data, are not visible, except for the figure of declining car purchases[48].
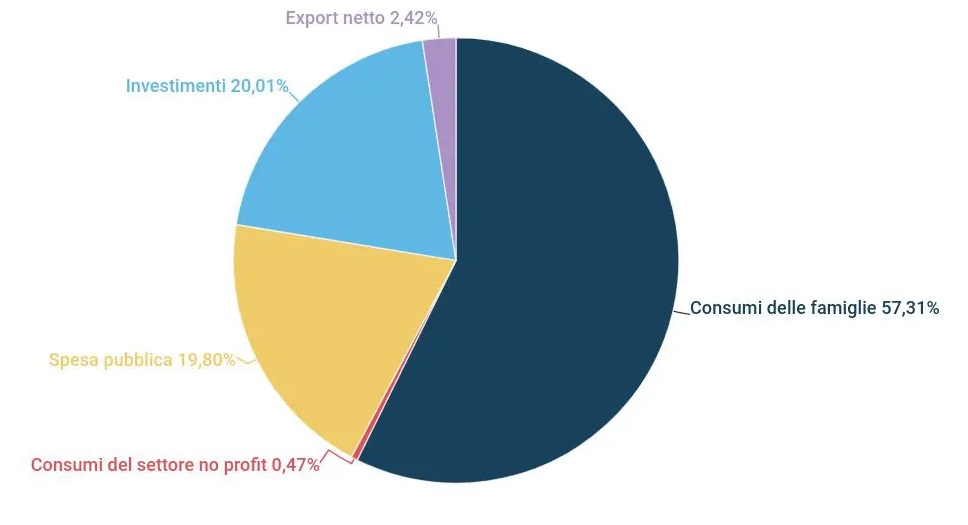
Italy’s GDP composition according to ISTAT[49]
The next question is: how does this influence the voters’ vote? In two parallel and opposing ways. On the one hand, it increases the esteem towards Mario Draghi of those who have benefited from the NRP and state support (which increases GDP but even more so the tax debt of every citizen towards their future), on the other hand it leads those who feel increasingly distressed (the overwhelming majority of Italians) to feel betrayed, mocked, abandoned – and who are now ready to vote for anything that opposes what they identify as the culprit of this situation: democracy[50].
Manipulations seek to avoid this drift, in the hope that the war in Ukraine will end, that the energy crisis will be resolved, that next year will not be as hot as this one, that the Covid will loosen its grip on the global population. According to the Confcommercio, things will be different: for 2022 it expects inflation to be over 7%, for 2023 5.4%, but provided that no new traumatic events occur – this is not a statistical assessment, but a political perception of the damage now done by the current recessionary crisis and its impact on the growth of the indebtedness of states and citizens[51].
The Bank of Italy thinks along the same lines, and forecasts “a worsening of the war in Ukraine such as to bring about a halt in Russian energy supplies, with production interruptions in industrial activities characterised by higher energy intensity, higher increases in raw material prices, a stronger impact on uncertainty and confidence, and weaker dynamics of foreign demand”, whereby “inflation would reach 9.3% in 2022 and remain high even in 2023, at 7.4%, only to fall markedly in 2024”[52]. The conclusions are really worrying: “On this type of scenario, last 10 June in the coordinated exercise of the Eurosystem of central banks, Bankitalia forecast almost zero growth in 2022 and a cut in expansion of more than 1 percentage point in 2023, with inflation at 8% this year and 5.5% in 2023”[53].
This reasoning does not take into account possible effects of the next government’s policy choices. If it goes well, nothing will change: no one believes that they will have positive influences, only that they will worsen the system’s debt exposure. In this framework, ISTAT is the dance orchestra that, on the Titanic, continues to play while the ship sinks.
[1] https://aforisticamente.com/frasi-citazioni-aforismi-winston-churchill/
[2] https://www.repubblica.it/commenti/2022/06/27/news/istat_e_bonomi_chi_ha_ragione-355672843/
[3] https://www.treccani.it/enciclopedia/istat
[4] https://www.ilfattoquotidiano.it/2022/06/26/il-presidente-di-confindustria-bonomi-se-la-prende-con-listat-perche-i-numeri-non-gli-piacciono-boeri-pericoloso-e-populista/6640493/
[5] https://www.ilfattoquotidiano.it/2022/06/26/il-presidente-di-confindustria-bonomi-se-la-prende-con-listat-perche-i-numeri-non-gli-piacciono-boeri-pericoloso-e-populista/6640493/
[6] https://www.firstonline.info/istat-confindustria-e-scontro-assurdo-lattacco-di-bonomi-che-accusa-listituto-di-truccare-i-dati/
[7] https://www.firstonline.info/istat-confindustria-e-scontro-assurdo-lattacco-di-bonomi-che-accusa-listituto-di-truccare-i-dati/
[8] https://www.firstonline.info/istat-confindustria-e-scontro-assurdo-lattacco-di-bonomi-che-accusa-listituto-di-truccare-i-dati/
[9] https://www.firstonline.info/istat-confindustria-e-scontro-assurdo-lattacco-di-bonomi-che-accusa-listituto-di-truccare-i-dati/
[10] https://www.unisalento.it/documents/20152/693704/Prof.+Sunna+-+Slides+2.pdf/0d291d02-866d-7899-a68f-604c09467fc0?version=1.0 ; https://www.lavoce.info/archives/20225/metti-sesso-droga-contrabbando-calcolo-pil/
[11] https://unstats.un.org/unsd/EconStatKB/Attachment279.aspx?AttachmentType=1 N
[12] https://www.oecd.org/sdd/na/1963116.pdf
[13] Emilio Gabba, Dionigi e la storia di Roma arcaica, Bari, Edipuglia, 1996
[14] https://www.unisalento.it/documents/20152/693704/Prof.+Sunna+-+Slides+2.pdf/0d291d02-866d-7899-a68f-604c09467fc0?version=1.0 ; https://www.lavoce.info/archives/20225/metti-sesso-droga-contrabbando-calcolo-pil/
[15] https://www.unisalento.it/documents/20152/693704/Prof.+Sunna+-+Slides+2.pdf/0d291d02-866d-7899-a68f-604c09467fc0?version=1.0 ; https://www.lavoce.info/archives/20225/metti-sesso-droga-contrabbando-calcolo-pil/
[16] https://www.lavoce.info/archives/20225/metti-sesso-droga-contrabbando-calcolo-pil/
[17] https://ricerca.repubblica.it/repubblica/archivio/repubblica/1994/02/10/contrabbandieri-in-rivolta-dai-vicoli-invadono-le.html
[18] https://www.oecd.org/sdd/na/1963116.pdf
[19] https://www.istat.it/it/files/2014/01/regolamento_esa2010.pdf
[20] https://www.glistatigenerali.com/bilancio-pubblico_materie-prime/tasse-sul-gas-e-collasso-della-democrazia/
[21] https://www.rnz.co.nz/national/programmes/sunday/audio/20153949/the-cost-of-economic-crime
[22] https://www.istat.it/it/files//2011/01/testointegrale20100713.pdf
[23] https://docenti.unimc.it/raffaella.coppier/teaching/2019/19910/files/economia-sommersa/ardizzi-et-al.-2012 ; https://www.lavoce.info/archives/20225/metti-sesso-droga-contrabbando-calcolo-pil/
[24] https://www.lavoce.info/archives/20225/metti-sesso-droga-contrabbando-calcolo-pil/ ; http://www.sosimpresa.it/userFiles/File/Iniziative/XII_RAPPORTO_SOS_IMPRESA_-_SINTESI_PER_LA_STAMPA.pdf ; Fabi, F., Ricci, R. e Rossi, C. in Rey G., Rossi C. e Zuliani A. (2011) Il mercato delle droghe – Dimensione protagonisti, politiche, Marsilio
[25] https://www.lavoce.info/archives/20225/metti-sesso-droga-contrabbando-calcolo-pil/
[26] https://www.istat.it/it/files/2015/01/Modernizzazione-indagini-famiglie.pdf
[27] https://www.lavoce.info/archives/22917/listat-che-vorremmo/
[28] https://www.lavoce.info/archives/22917/listat-che-vorremmo/
[29] https://www.lavoce.info/archives/22917/listat-che-vorremmo/
[30] https://www.lavoce.info/archives/22917/listat-che-vorremmo/ ;
[31] “L’indagine europea sui redditi e le condizioni di vita delle famiglie (Eu-Silc)”, 2008, Pag. 7-8 https://www.istat.it/it/files/2014/06/met_norme0837_indagine_europea_sui_redditi_Eu-Silc.pdf
[32] “Measuring social exclusion: strengths and limits of the European indicator AROPE”, Eleonora Clerici, Pag 6 https://phd.uniroma1.it/dottorati/cartellaDocumentiWeb/b3b47afc-fab7-4e1d-b0a9-8b4d9ca5e058.pdf
[33] https://ec.europa.eu/eurostat/statistics-explained/index.php?title=File:Coverage_rates_of_EU-SILC_data_and_their_stability_over_time_as_compared_with_the_National_Accounts_aggregates,_gross_disposable_income,_2015,_%25.png
[34] https://phd.uniroma1.it/dottorati/cartellaDocumentiWeb/b3b47afc-fab7-4e1d-b0a9-8b4d9ca5e058.pdf
[35] https://phd.uniroma1.it/dottorati/cartellaDocumentiWeb/b3b47afc-fab7-4e1d-b0a9-8b4d9ca5e058.pdf ; Arora V. S., Karanikolos M., Clair A., Reeves A., Stuckler D., McKee M., Data Resource Profile: “The European Union Statistics on Income and Living Conditions (EU-SILC)”, International Journal of Epidemiology, p. 451–461, 2015. https://academic.oup.com/ije/article/44/2/451/753868 ; Peña-Casas R., Europe 2020 and the fight against poverty and social exclusion: fooled into marriage?, Social developments in the European Union, 2011. https://etui.org/sites/default/files/C6%2012%20Social%20Development%202011%20Web%20version%20EN.pdf
[36] https://phd.uniroma1.it/dottorati/cartellaDocumentiWeb/b3b47afc-fab7-4e1d-b0a9-8b4d9ca5e058.pdf
[37]Nolan B., Whelan C.T., The EU 2020 Poverty Target. Amsterdam, AIAS, GINI Discussion Paper 19, 2011. https://www.academia.edu/54424028/GINI_DP_19_The_EU_2020_poverty_target?bulkDownload=thisPaper-topRelated-sameAuthor-citingThis-citedByThis-secondOrderCitations&from=cover_page
[38] Peña-Casas R., Europe 2020 and the fight against poverty and social exclusion: fooled into marriage?, Social developments in the European Union, 2011. https://etui.org/sites/default/files/C6%2012%20Social%20Development%202011%20Web%20version%20EN.pdf
[39] https://www.money.it/pil-cosa-e-calcolo
[40] https://www.truenumbers.it/composizione-pil-italiano/
[41] https://www.truenumbers.it/composizione-pil-italiano/
[42] https://www.istat.it/it/files//2022/06/REPORT_CONSUMI_2021_rev.pdf
[43] https://www.istat.it/it/archivio/273781
[44] https://www.istat.it/ws/fascicoloSidi/1280/Spese%20delle%20famiglie%202022%20-%20Diario.pdf
[45]https://www.confcommercio.it/documents/20126/3660224/Nota+di+aggiornamento+sui+consumi+delle+famiglie+e+le+spese+obbligate.pdf/b57f8892-75f1-8d46-a153-ba7821c8a23e
[46] https://www.confcommercio.it/documents/20126/3660224/Nota+di+aggiornamento+sui+consumi+delle+famiglie+e+le+spese+obbligate.pdf/b57f8892-75f1-8d46-a153-ba7821c8a23e
[47]https://www.confcommercio.it/documents/20126/3660224/Nota+di+aggiornamento+sui+consumi+delle+famiglie+e+le+spese+obbligate.pdf/b57f8892-75f1-8d46-a153-ba7821c8a23e
[48]https://www.confcommercio.it/documents/20126/3660224/Nota+di+aggiornamento+sui+consumi+delle+famiglie+e+le+spese+obbligate.pdf/b57f8892-75f1-8d46-a153-ba7821c8a23e
[49] https://www.truenumbers.it/composizione-pil-italiano/
[50]https://www.confcommercio.it/documents/20126/3660224/Nota+di+aggiornamento+sui+consumi+delle+famiglie+e+le+spese+obbligate.pdf/b57f8892-75f1-8d46-a153-ba7821c8a23e
[51]https://www.confcommercio.it/documents/20126/3660224/Nota+di+aggiornamento+sui+consumi+delle+famiglie+e+le+spese+obbligate.pdf/b57f8892-75f1-8d46-a153-ba7821c8a23e
[52] https://www.milanofinanza.it/news/bankitalia-alza-le-stime-di-crescita-dell-italia-per-il-2022-ma-taglia-il-pil-per-il-2023-202207151516079944
[53] https://www.milanofinanza.it/news/bankitalia-alza-le-stime-di-crescita-dell-italia-per-il-2022-ma-taglia-il-pil-per-il-2023-202207151516079944
Leave a Reply